Quick Start
The main interface can be imported as follows:

Creating Simple Plots
The simplest thing that can be done is to create a blank plotter and, subsequently, a blank plot. This can be accomplished as follows:

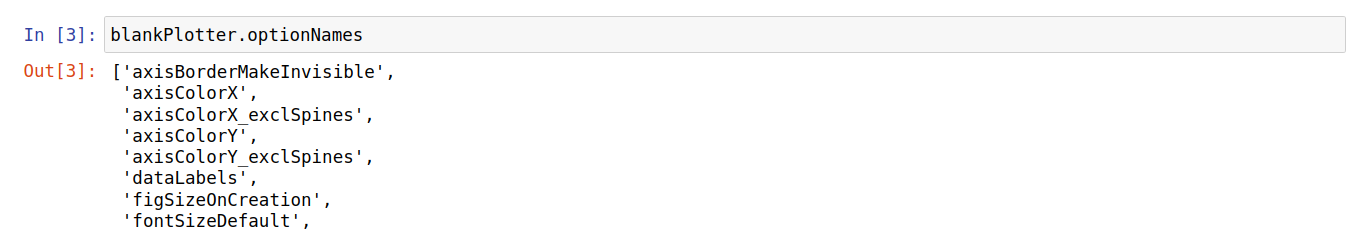
The plotter object essentially encapsulates all the options and commands needed to make a plot. We can set various options to create more complicated plots. A list of all option names can be accessed via the “optionNames” property as follows:
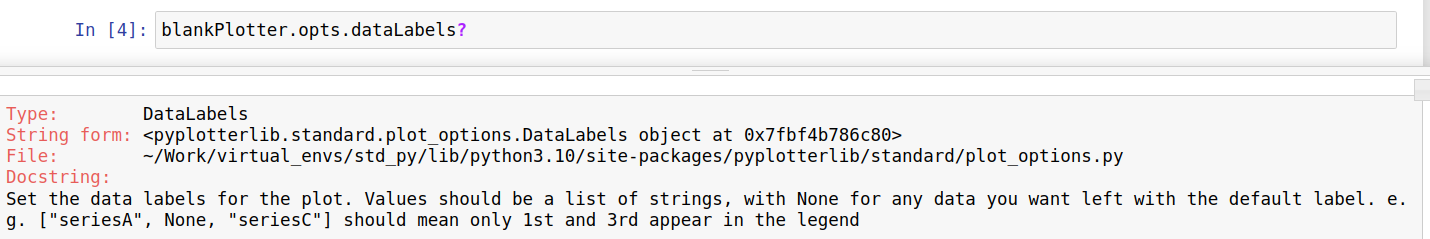
We can see what each of these corresponds to in a jupyter notebook as follows, using dataLabels as an example:
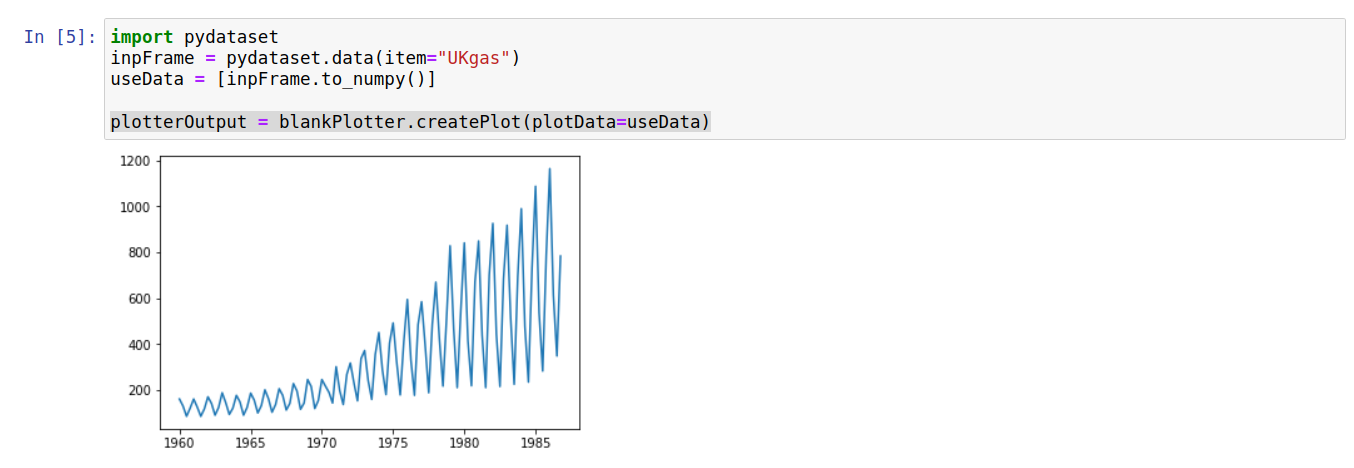
We can modify the options for a single plot by passing optionName=optionValue at plot-creation time. This can be seen best using an example, where we add some data to our plot:
We can verify that this was only changed for a single plot by trying to create another plot without passing the plotData argument:

This behavior allows a plotter to be used as a rough template for when you want to create multiple similar plots (e.g. multiple line plots with the same axis labels but different data).
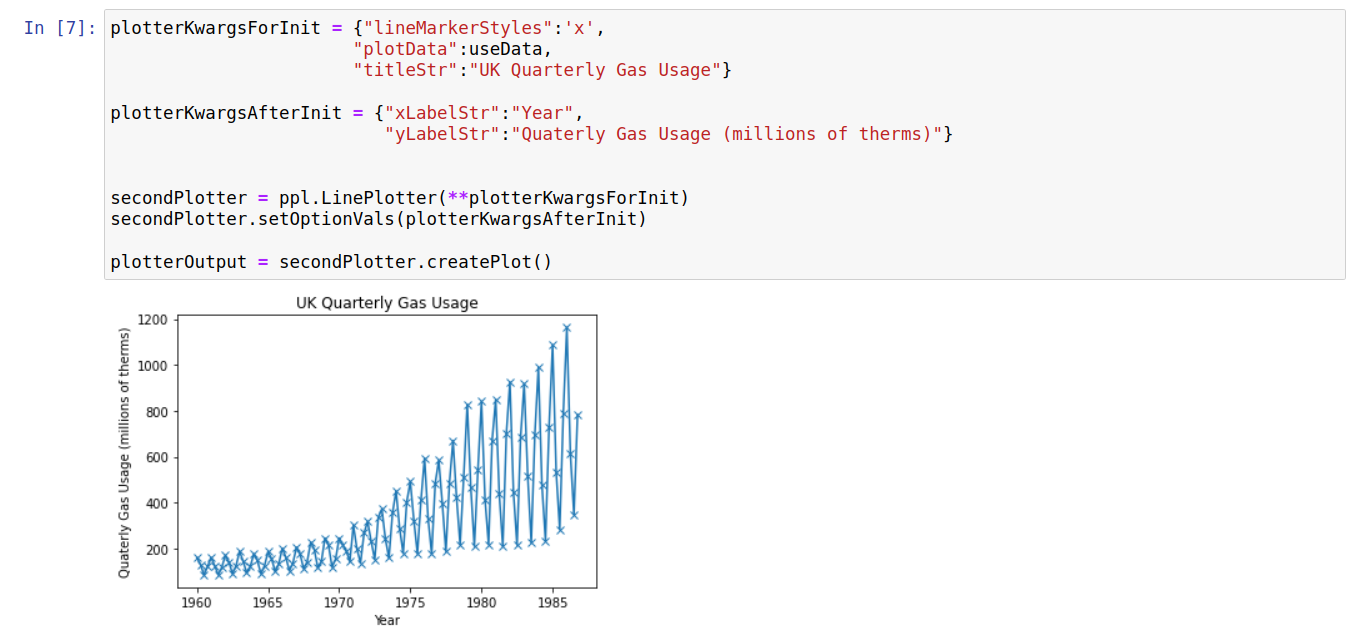
Options can also be set on the plotter-level; in this case these are the defaults for the objects createPlot function. These values are generally set upon initialization by passing optionName=optionValue pairs or post-initiation using an {optionName:optionVal} dictionary. The code sample below shows both methods being used:
Saving Plotters/Plots
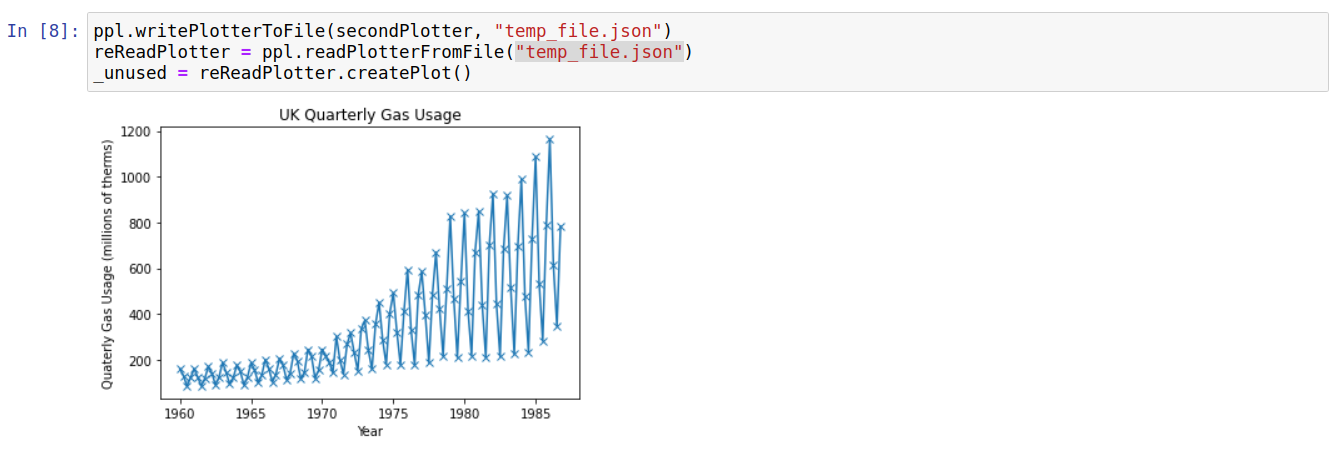
Currently, there is an in-built method for reading/writing any in-built plotter to a file. This provides a simple way to transfer plotting templates (for example) between notebooks/computers/people. The small code segment below demonstrates how to write/read plotters to a file:
For now, there isnt a built in way to save image files (e.g. .png or .eps) corresponding to the created plots. However, the plots are created by matplotlib; therefore you can use their method for saving a plot-image to file:
